Heartland AgricultureStreet Economics® · Florida's Heartland on a network and a lineage
Street Economics®

Florida Heartland Agriculture

A network and lineage map of the agriculture economy of Florida's Heartland: the families, companies, towns and institutions that assembled it over 140 years, the land they hold, and the three forces reworking it now: greening, outside capital and a vegetable economy no map has shown.

Work in progress. This map is not exhaustive. It presents the result of documented research at this release and changes as sources are added, corrected, or superseded. Every node is based on at least one public source and carries its sources and confidence class. If something is missing or wrong, submit it.

This map uses public business records, public corporate filings, property records, public calendars, public civic documents, public press coverage and public listings. It maps commercial infrastructure and documented civic activity, not endorsements, partnerships or private cultural behaviour. Inclusion does not require participation, consent or approval. The map corrects factual errors promptly and considers removal requests case by case where a listing is outdated, an entity has closed, publication presents a material safety concern, or the entity is not conducting public facing commercial activity. Public commercial infrastructure is mappable; private cultural behaviour is protected.
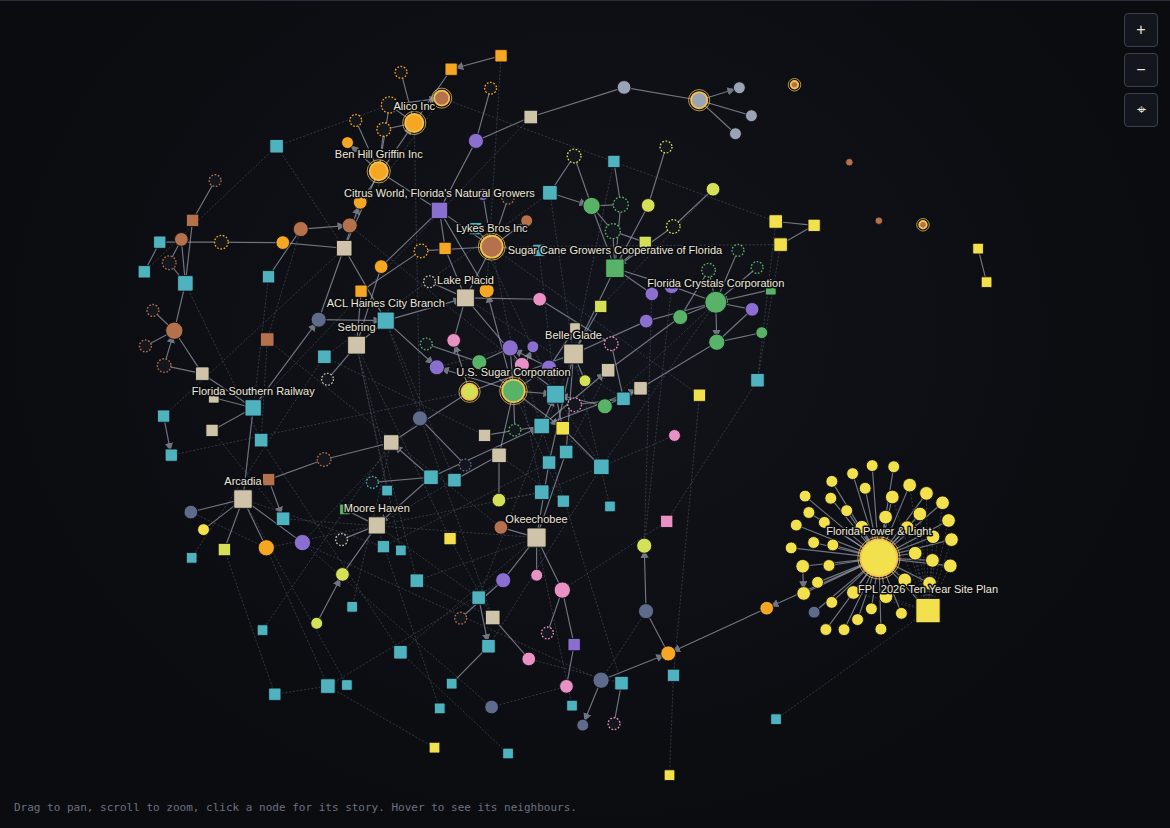
243 operations, people, towns, institutions and events · 329 connections · 11 layers of the place · 4 districts and 3 clusters
Version 1.0.1. Data current through 12 September 2026. Activity after that date is described as announced or scheduled, never as completed.
The network view of the interactive mapNetwork view. Three more: Lineage timeline, the region at county scale, and 3D, plus a Play animation from 1830 to 2026.

Read the reference

The same text as the PDF, generated from the same data file as the map, so the counts never disagree.

Reading the mapOne economy, assembledWhat the nodes and lines mean, the inclusion rules, timeline placement, the people rule, the founding year rule, districts and hubs, the outside share and the eleven lanes of the economy.The regionHow it assembled itselfHow the economy assembled itself, decade by decade, from the Hamilton Disston purchase of 1881 through drainage, railroads, freezes, the dairy buyout and the greening years, with the accretion curve.The landThe land and its ownersThe module reference section: the 2,324,300 acre agricultural base, the classes and districts, the ownership split with its everyone else side and the small producers who hold it, the owner table with the natural break that leaves Lykes Bros alone, the check columns and the 18 announced conversions.Current casesFive mechanismsFive mechanisms: greening and the grove to pasture turn, the sugar complex, a tier of one, the solar wave, and the invisible vegetable economy, with status as of the cutoff.Network metricsWhat holds the region togetherDegree, betweenness and the outside share computed on this dataset, on the full graph and on the location and lineage graph.MethodConfidence and sourcesConfidence grades, the evidence standard, the module as source of record, the basemap and pin sources, districts, terminology, open items and the source register.AppendixIndex of nodesEvery operation, person, town, institution and event on the map, grouped by lane, each with its own entry.

Current cases: five mechanisms

Five cases singled out because each shows a different mechanism. Node size, centrality and the outside share are computed, not adjusted.

Citrus · The GladesGreening and the grove to pasture turnOne disease rewrites the land use of a district in twenty years. Module class figures, USDA citrus series and the corporate record of the wind downs.Sugar · The GladesThe sugar complexThe densest lane on the map: two companies, one cooperative and the towns they hold. Corporate records, the module owner table and the public record of the 2010 river of grass acquisition.Cattle and ranching · The GladesA tier of oneThe natural break in the owner table leaves one family company alone at the top. The module owner table and the company's own stated figures.Energy and land conversion · Outside the HeartlandThe solar waveEighteen announced energy centers, every one coded announced, never completed. The FPL 2026 Ten Year Site Plan and the module's announced conversion table.Vegetables, melons and row crops · Peace River valleyThe invisible vegetable economyA rotational economy on leased range that the parcel roll cannot see. County extension records, the association's own record and the module's DeSoto limitation note.

Eleven lanes of the economy

Every node belongs to one lane. Open any lane in the index of nodes.

Most connected in this dataset

Betweenness on the full graph: the nodes that bridge otherwise separate parts of the map. Full table and method.

  1. Florida Power & Lightoperation or company · betweenness 0.331
  2. Consolidated Citrus LPoperation or company · betweenness 0.309
  3. Turner Foodsoperation or company · betweenness 0.305
  4. Peace River Citrus Productsoperation or company · betweenness 0.226
  5. Arcadiatown · betweenness 0.219
  6. Coca-Cola and Minute Maidoperation or company · betweenness 0.210
  7. Belle Gladetown · betweenness 0.163
  8. Florida Southern Railwayorganisation · betweenness 0.150

Data and downloads

The PDF reference, the Excel dataset and data.json, with the rules, the evidence standard and how to cite, on the data page.